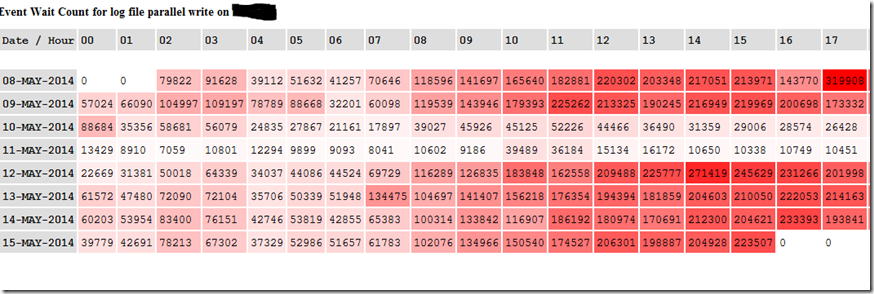
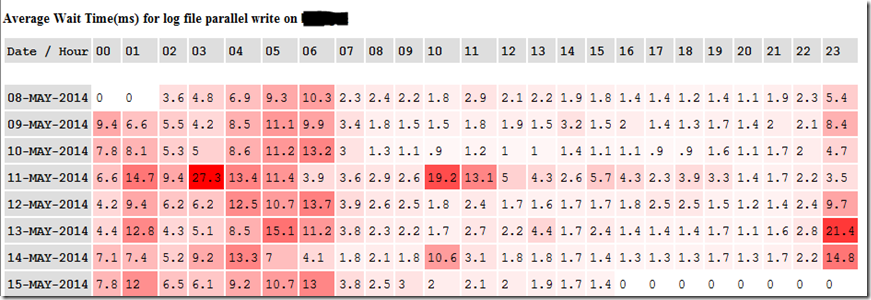
Jeff Smith pointed out David Mann’s blog in recent session on SQL Developer Reporting. Using David’s base code I have developed SQL developer heat map reports to visualize, troubleshoot and compare IO related waits.
From above we can clearly visualize that on 11-MAY-2013 between 2:00 – 3:00 pm average wait time for log file parallel write event was 27.3 ms. The number of waits during same time slot was 10801 which is equivalent to 3 waits per second and that’s not significant. If intermittent slowness was reported by application team and if it was related to commit wait class, DBAs need to engage SA/SAN team to investigate this further.
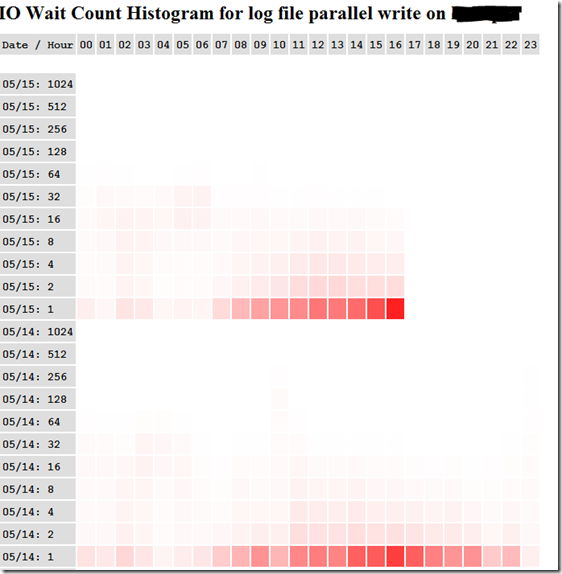
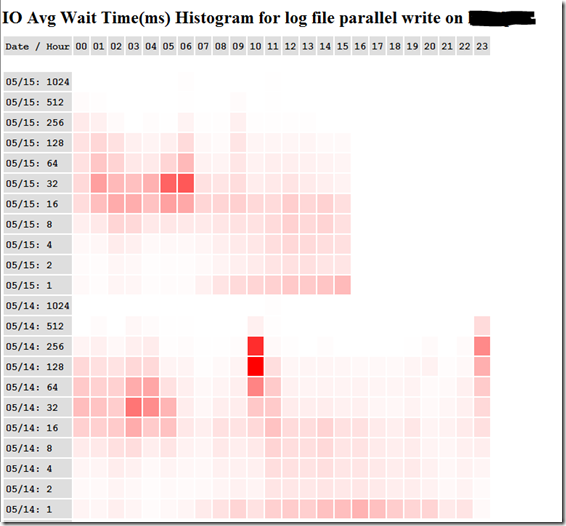
Below are IO wait histogram reports for log file parallel write event on same database instance. For OLTP workload you want to see bright red boxes for log file parallel write between 1 and 16ms buckets for wait counts and average wait times. Such heat maps can also be used to do relative performance comparison by Day or Day/Hour.
Download (I will upload SQL developer report definition files early next week.)
Another example of vertical stacked bar chart.
IO Wait Histogram by Count – db file sequential read
IO Wait Histogram by Avg Wait Time(s) – db file sequential read
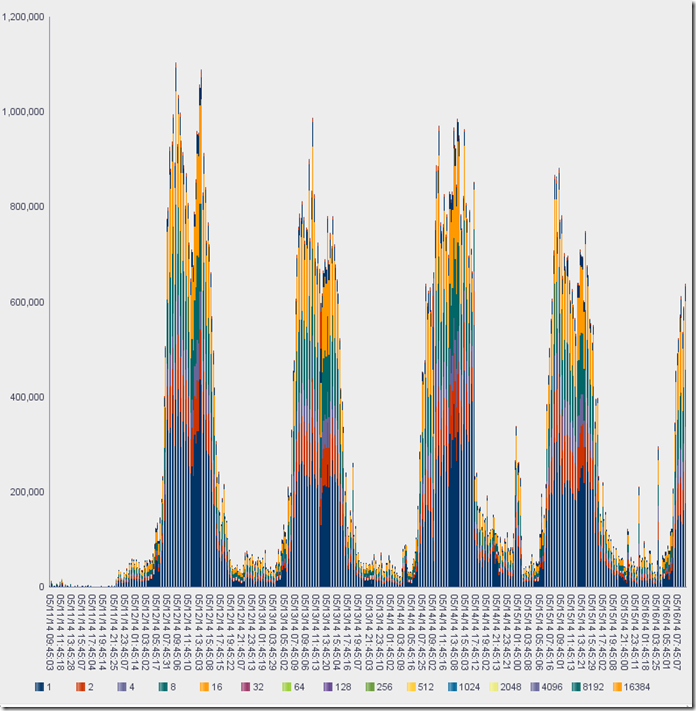
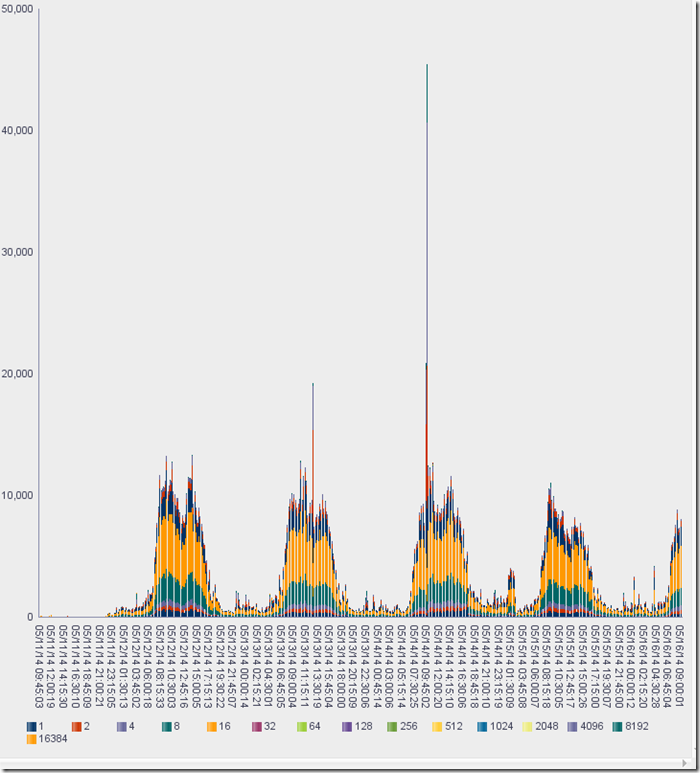
Love this Vishal, awesome work. Would love to talk to you about ways to combine the top 2 graphs into one so counts/timings can be seen on the same graph.
Comment by David Mann — June 26, 2014 @ 4:48 pm
hi vishal,
Sorry i am posting all over your blog, but i can only imagine how much this is going to help me with my performance issue we have at my shop….
Great work…
I downloaded the zip file and that came with below 3 XML files…
stats_trend
waitcount
waittime
But look at your blog above looks like is there a one missing with regards to IO Wait count histogram and IO Avg wait time(ms) histogram ?
Comment by Max Scalf — November 20, 2014 @ 1:30 pm
Hi Max,
Thanks for pointing that out. I will upload report xml files tomorrow.
Thanks,
Vishal
Comment by vishaldesai — November 23, 2014 @ 9:13 pm
Thank VIshal, Looking forward to those
Comment by Max Scalf — November 24, 2014 @ 8:25 pm
hi Vishal, i was wondering if you had a chance to push these out so i can download them?
Comment by Max Scalf — December 2, 2014 @ 4:54 pm
hi Max, I included two more xml report files in zip. Please check and let me know.
Comment by vishaldesai — December 2, 2014 @ 6:19 pm
Got it. Thank you very much.
Great Work!!!
Comment by Max Scalf — December 2, 2014 @ 8:20 pm